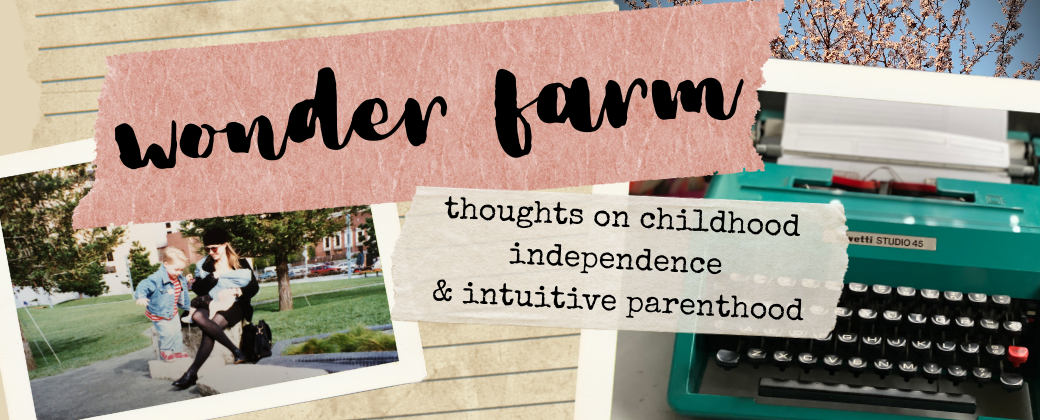
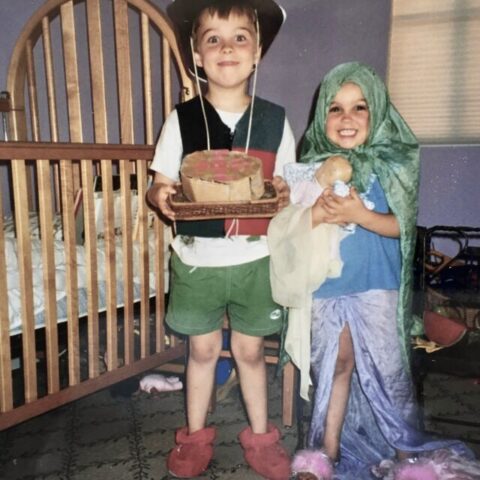
Apologies for centering my picks–I needed a horizontal photo! Dear fellow wonderer, I keep hearing about parents wanting to give their kids a ’90s childhood or a ’90s summer and while I love this, it has me thinking: maybe what we really need is a ‘90s motherhood. A chance to be mothers in a space without [...]
the era in question Dear fellow wonderer, A few months back, when I interviewed Minna Dubin about her book Mom Rage, I asked about a line from the book: When I became a mother, I didn’t know there was a grand PR narrative of Motherhood to buy into or resist. Intensive mothering had infiltrated the [...]
poet of my heart Dear fellow wonderer, Since October, I’ve been hosting a monthly reading series for caregivers at a new-ish and lovely community space here in Oakland, Local Economy. The experience has been–pardon the un-poetic hyperbole–magical. Brilliant writers plus caregivers of all ages, a circle that welcomes conversations, and babies in the center, warming [...]
Dear fellow wonderer, Lately I’ve been wondering what today’s parents think of play. We all know play is good for kids, but I suspect it may sometimes seem like one more responsibility, one more thing to fit into busy lives, one more thing to maximize. Something to do with kids, maybe, to make sure they [...]
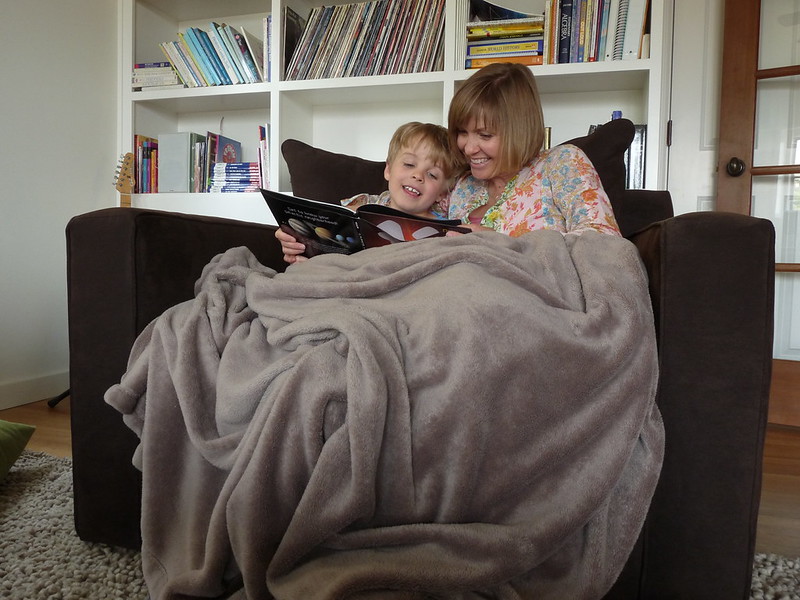
He liked to pile us with blankets when we read together. He called it “a jumble of cozy.” Dear fellow wonderer, Shifts in childhood, shifts in parenthood. That’s my thing here, as you know. Recently I came across a shift that made my chest pang: “Fewer than half of parents of children up to 13 [...]
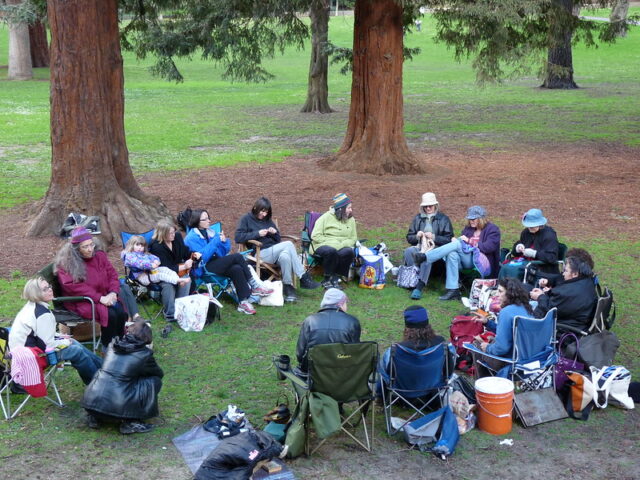
I’ve used this photo before; I’ll surely use it again. Our weekly circle, back in the day. Dear fellow wonderer, Recently a Substack note from Edan Lepucki caught my eye. I always love Edan’s takes on parenthood. She was reflecting on a list of tips for having a baby. While she admired much of the [...]
Dear fellow wonderer, Here we are smack in the middle of holiday season and who needs another newsletter anyway? Maybe you if you’re like me, finding yourself getting a little lost in the chaos, the organizing, the giving of self that this time of year often demands. Maybe you’re in the thick of life with [...]