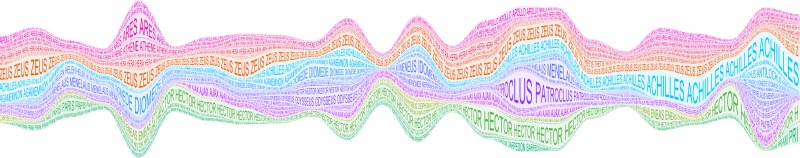
On Twitter last night, I came across something fascinating, via Maria at Brainpickings. (Always a source of fascinating bits.) It was an amazing visualization of the interactions of characters in the Iliad, and how they change throughout the book, by Argentinian designer Santiago Ortiz.
Do click here to view the stream in all its interactive glory. And then click on “network” for a different view. Mind-boggling.
I thought immediately of another graphic. A very low-tech graphic, in comparison, but one not entirely different. Remember the chart that Mr. T made last year, during his own fascination with The Iliad? It’s a chart of the various gods in The Iliad and how they interact with one another.

The thinking behind the two charts is quite similar, don’t you think? (You can see a bigger version here.)
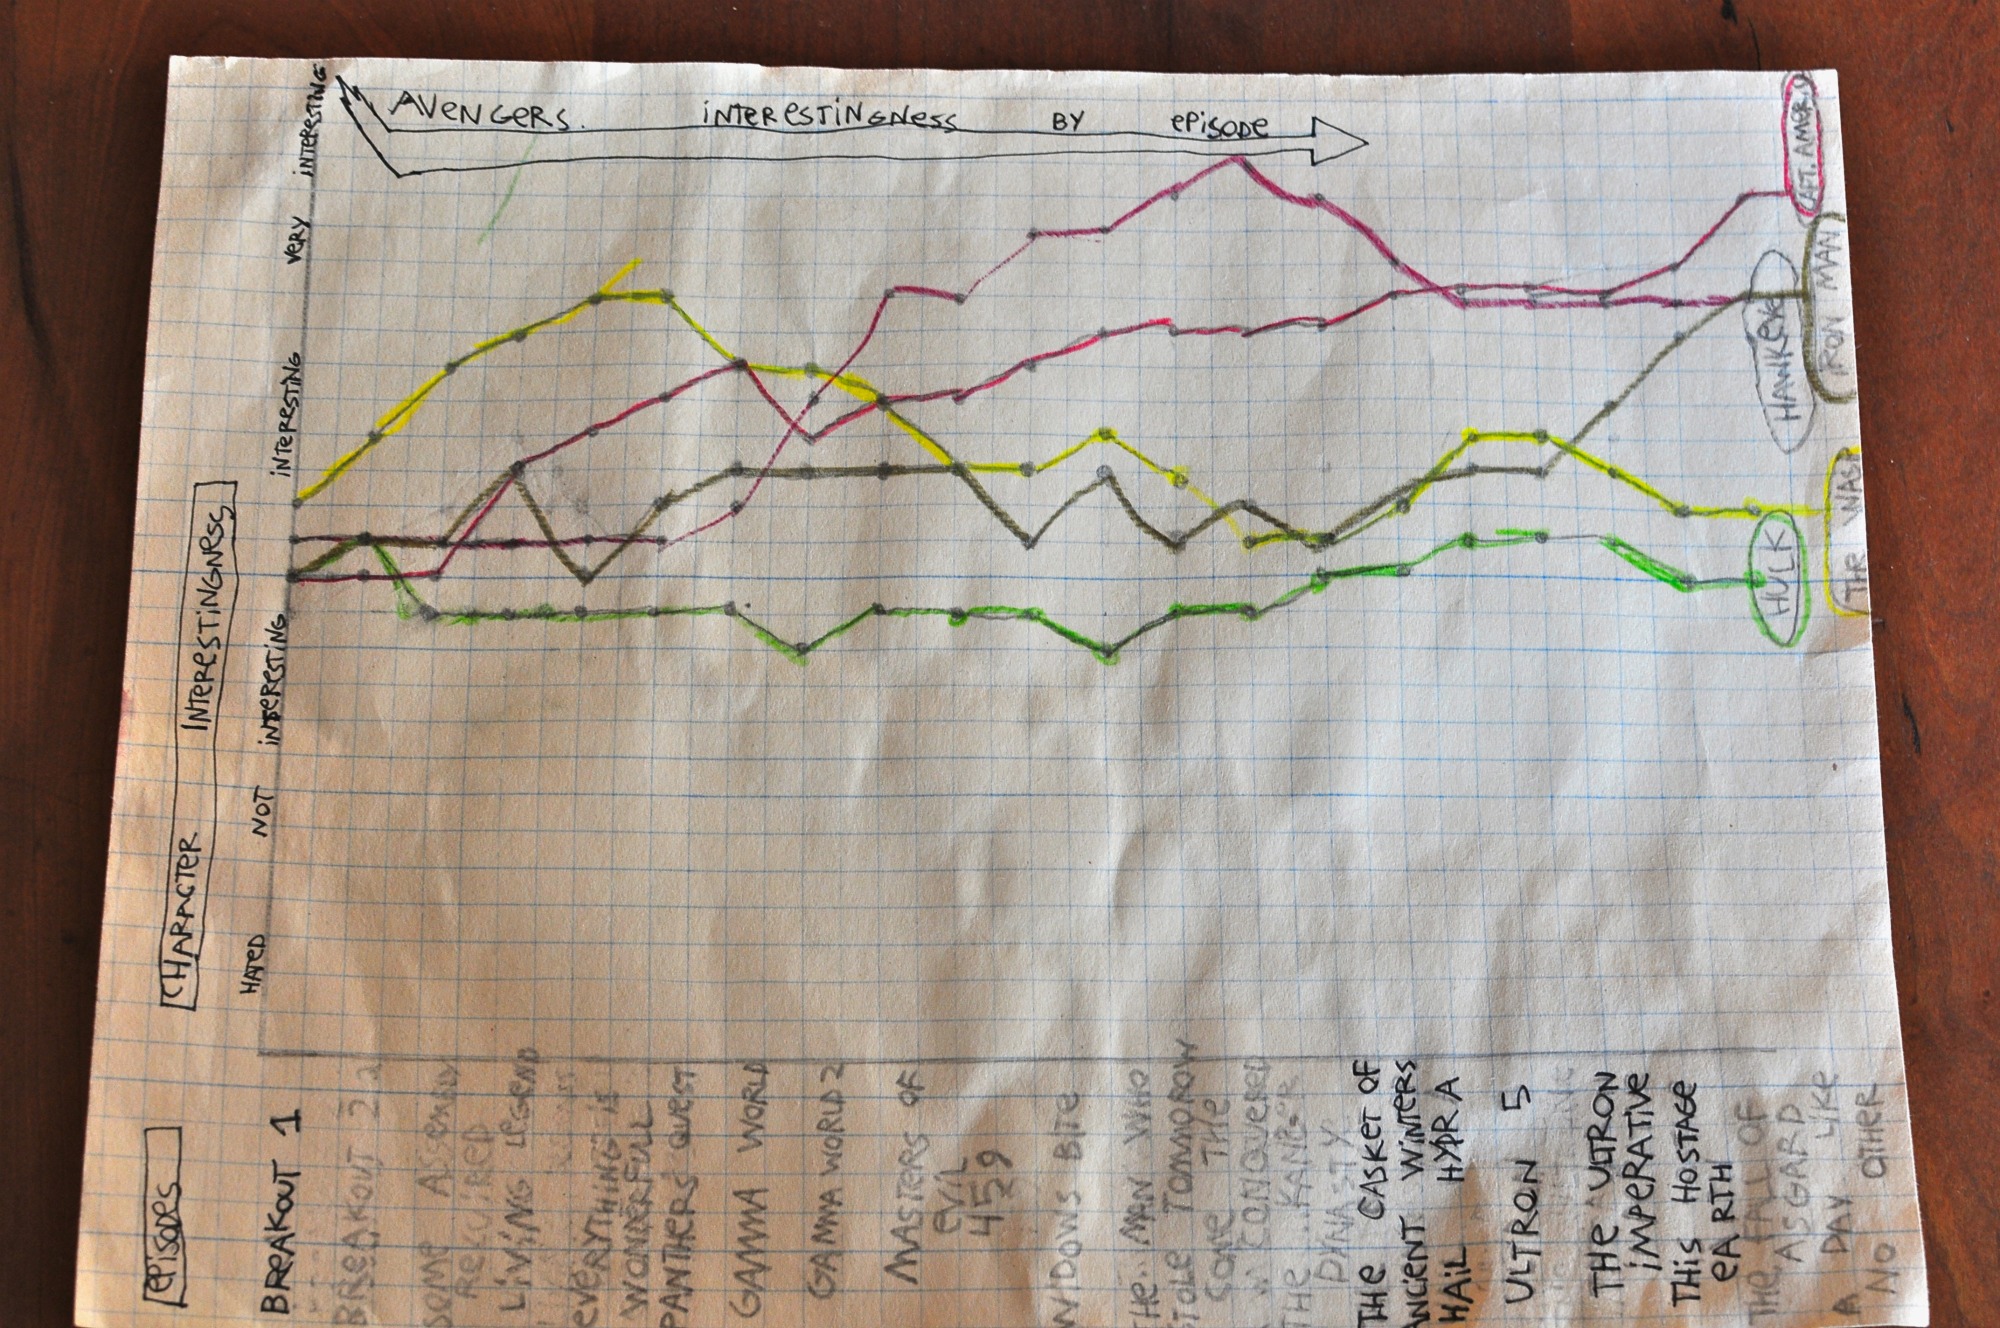
Then there was this other chart which I’ve shared with you, about Avengers characters and how their “interestingness” changes over the course of the series. (Bigger, clickable version here.)

What’s compelling to me is that T came up with these ideas on his own. Sure, I’ve shown him lots of graphs and charts and encouraged him to think about sharing his ideas graphically. But he’s considered what he’s taking in (everything from classic literature to a superhero series–not so different in this case) and decided how to interpret it.
Mostly he’s just having fun. But look at how closely his play is connected to Santiago Ortiz’ work! A year ago, I didn’t even know there was such a job as visualization designer. I hadn’t heard the word infographic. But this is the stuff of the future. All the more reason not to dismiss the likes of video games and time spent at the computer. You never know where that might take kids.
More evidence of how the world is changing? As soon as I saw Santiago’s work, I wanted to contact him and share Mr. T’s work. I had a feeling he’d appreciate it. T, of course, found Santiago’s work fascinating. I contacted Santiago via email, but then we continued our conversation on Twitter. Little tweets flying back and forth between California and Argentina. Now my kid has a visual designer to follow–and a whole new future career to consider.
In her fantastic book Now You See It: How the Brain Science of Attention Will Transform the Way We Live, Work, and Learn, Cathy Davidson writes,
“By one estimate, 65 percent of children entering grade school this year will end up working in careers that haven’t even been invented yet.” (p. 18)
How do we prepare our kids for that? I think all we can do is nurture our kids’ fascinations, watch the world as it changes and look for connections between the two.
At least we don’t have to design a graphic visualization of those connections. But maybe our kids will.
(Edited to add: if you’re here via Jer Thorpe’s website, hello! You might be interested in the follow-up post that tells a bit more about Mr. T’s interactions with Jer.)
Ooooooo. I’ve been all about graphic representations, lately. These are neat, all of ’em.
Also, hi! After a rough fall and winter, I’m easing into spring by reading blogs again, crocheting a bit and reading novels – three things I haven’t done in about a millions years. Glad to be reading you again. 🙂
Hiya! So nice to see you here again! Glad you’re finding time to crochet and read and stop by–important stuff. 😉
Good to know I’m not alone in my infographic geekiness!
That is amazing! I love infographics too and am always amazed at designers’ skills in making them.
The connection is fantastic. So too is your connection with the designed and Mr T’s new found mentor
Tricia
I love this. T (and you) never cease to amaze me!
I just met with this artist yesterday- please share with T. http://www.georgelegrady.com/
He runs a phd department at ucsb focusing on exactly this – visualizing data- all constructed with algorithms. Maybe T will want to reach out to him. I’ll introduce you two by email. How fun!
P.s. Did you know my degree was in visual design?
Xoxo
What fascinating work that artist is doing! It just astounds me how the art and visual world is changing, and what people are coming up with.
I think I’m probably more interested in this artist’s work than T would be at this point. I just like to keep up with the new media because it’s so amazing, and it helps me connect my kids with possibilities as they get older. So keep *me* up to date with what this guy is doing, please!
I did not know your degree was in visual design. L should talk to you about that at some point, because she has real interest there. What a world! What possibilities! Let’s have a glass of wine and talk about it all!
I love that you were able to share T’s work with a kindred adult spirit doing similar kinds of imagining and visualizing! What a cool connection.
I’ve been thinking about you lately and your encouragements to be open-minded about computer time and non-traditional ways of communicating. As I’ve mentioned to you before, my B. has been playing a lot with Scratch, the computer programming site for kids, trying so hard to create a video game that works–not easy at all. And guess what? My “non-writer” is taking baby steps into writing through Scratch. He’s posting comments on other kids’ work, having to figure out how to write words for computer code scripts, and generally immersing himself in a use of language and logic that is totally new and foreign to me. Exciting and unnerving at once, but mostly exciting. Thank you for helping me be comfortable with what he’s doing and not demonize it as “too much screen time”–though my own Waldorf guilt does kick in occasionally, it’s getting better all the time.
How fantastic, Carrie! It’s what you always hear: kids who aren’t forced to write will choose to write when they develop an interest that requires it. I’m excited for both of you!
Thank you so much for sharing this with me.
This is amazing.
I’m an artist who often makes charts and graphs as part of my work and I have to say that T has done an amazing job here (I’m also a huge Avengers fan, so this is doubly interesting to me!)
It would be great to see a map showing the connections between Avengers characters – maybe an idea for the next project!
– Jer Thorp
Data Artist in Residence, The New York Times
Hi Jer,
What a thrill to have you stop by and see T’s projects! He thought so too. He wanted to say this:
“I’m really happy that you looked at my work. I think it’s cool that you work at the New York Times, and I’m an Avengers fan too. I also really liked your graphics on your website.”
We had fun looking at your website together, and seeing how complex and stunning graphs and charts can be. Thank you for taking the time to encourage T. It means a lot to both of us!
Patricia, Jer is absolutely top-notch in the field. You have to see this video http://www.ted.com/talks/jer_thorp_make_data_more_human.html in which he claims that technology and data revolution should become be more humanistic
Holy cow, Santiago, that was amazing! I actually teared up when Jer showed the data point of when he met his girlfriend.
What a fascinating world the two of you work in. I’m awed, and so grateful to know this world is out there, and to be able to share it with my son. Thank you for making yet another fantastic connection for us.
Wow about some of those links.
When I was a kid we used to graph our scores, playing 5-handed 500. And whoever had the most severe ups and downs got to claim having had the most fun, regardless of who actually won.
Love that, wanderingsue!