
So, what do you do when you homeschool and you have a kid who doesn’t take to projects? Who loves to read and research and talk, but has utterly no interest in taking those ideas and making a model, or painting a picture, or crafting a handmade book?
When you have a kid whose interests run from video games to role-playing games to comics and back to video games (with maps, WWII and string theory thrown in for good measure)?
A kid who could spend all afternoon researching Top Ten lists on the Internet—Top Ten Video Game Clichés, Top Ten Influential Communist Leaders, Top Ten Simpsons Episodes, Top Ten Ways the World Might End in the Next 100 Years—and then wants to regale you with all of those nuggets, naturally, until your find yourself pondering the top ten ways your brain might explode?
I have one word for you, my friends, just one word: infographics.
I’d never heard much about infographics until a few years ago. Those of you who’ve been hanging around these parts for a while will remember how Mr. T made a few graphs about characters from Marvel and The Iliad, and we made an online connection with a visual designer, which led to an exciting interaction with the former Data Artist from the New York Times. Suddenly I realized that infographics and data artists are the hip, newfangled thing. (National Geographic agrees. T was cutting up magazines, making a collage for me for Christmas, when he found that his new data artist friend, Jer Thorp, had won an Emerging Explorers award. What Jer does is terabytes more complex than making simple infographics; his work is awe-inspiring. Check it out. See? Hip and newfangled.)
An infographic (for those of you still oldfangled) is simply a visual representation of data or information. Infographics convey complex ideas in an easily understandable way. The best make information compelling using the tools of a storyteller, and they do so with beautiful design. Basically, infographics attempt to take a bit of information from the Internet Overwhelm, and present it in a compelling way that the viewer can’t ignore. Do a Google image search for infographics for a sampling.
Anyway, Mr. T was searching for a topic to explore for our homeschool group’s Science and Math Fair (an event modeled on our long-running history fair.) He toyed with the idea of researching the possibility of alien life, but the research turned out far less thrilling than his own fevered ideas about alien life.
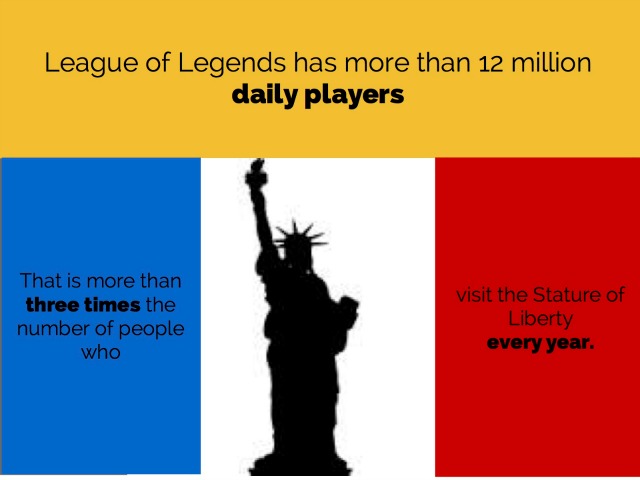
Meanwhile, he’d been playing an online game called League of Legends, and he kept telling me how much he liked it, and how popular it is. It didn’t really sink in until he showed me this infographic. (Click to enlarge the image if you’re into this sort of thing.) Turns out that twelve million people play the game each day. They play for over a BILLION hours each month.
I guess he was right about this game being slightly popular.
We talked about how fun it might be to put those numbers into perspective. And with that T decided to make his own infographics for the fair, to convince people that this game he loves is worth their attention.
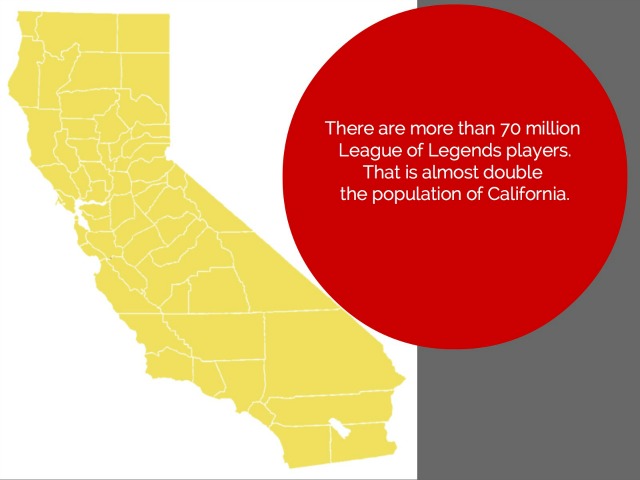
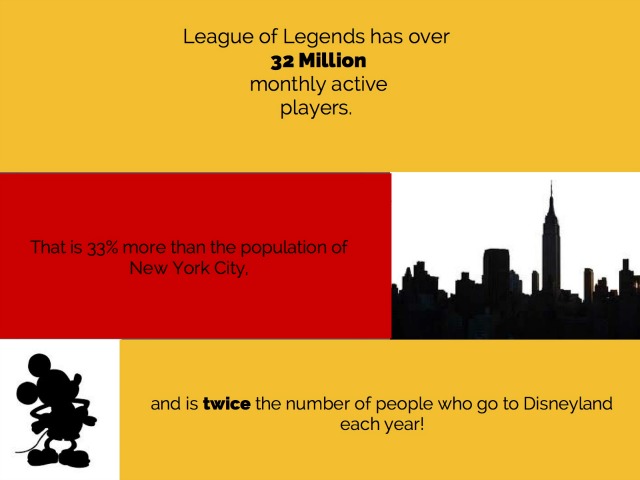
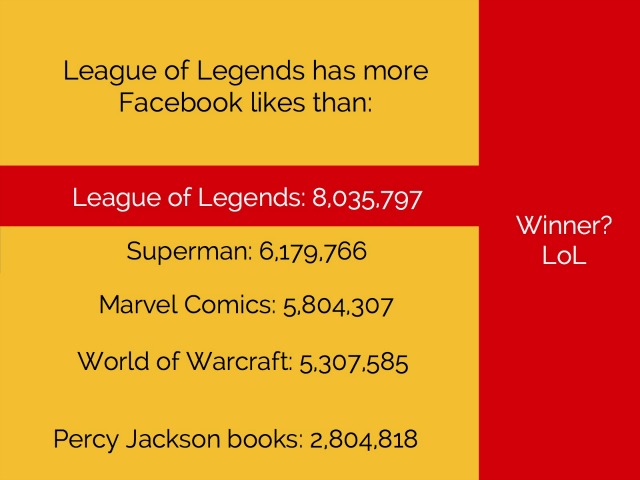
He took data from the published infographic and tried to relate it to other data that might be more understandable to people who aren’t video game zealots like he is. This involved imagination and research. A few samples of what he came up with:
This is my favorite. Just read it, pause and consider.
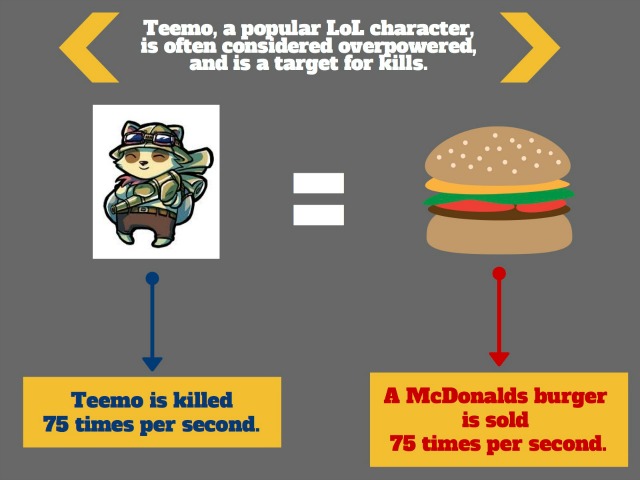
Did you get that? This single character (there are over 100 in the game) is killed as often as a burger is sold by McDonald’s worldwide. I didn’t think anything could happen as often as a McDonald’s burger is sold, except maybe breathing. The fun part about this graphic is that T made the connection on his own. He read that Teemo is killed 75 times a second, and then remembered having read elsewhere that 75 McDonald’s burgers are sold per second. (The boy is a fact-fiend.) Hard not to read that without muttering wow.
And that was the fun part of T’s display at the fair. It made lots of people mutter wow. Particularly the adults–those kind homeschooling parents who look at all of the displays with interest and delight. They began politely reading T’s display, and then you’d see their eyes widen. Really? they’d say. Wow.
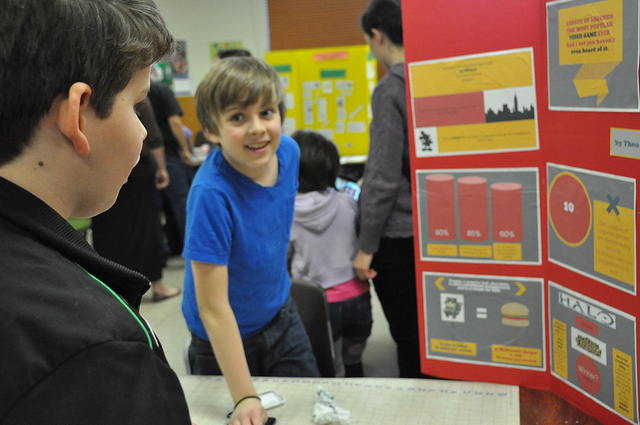
And that is precisely what an infographic is designed to do. Did T get a kick out of wowing people? Check out his expression in the photo at the top of this post.
If you’re curious, T used Canva to make these infographics. Canva is a newish, free, online design platform for people who don’t have access to expensive programs like Photoshop. It was a little unwieldy for a kid to use, but T managed with lots of help from me. It’s a pretty neat platform for this sort of thing, with lots of fun fonts and graphics to choose from, and that free thing going for it.
It’s funny. If it had been up to me, T might have had a snazzy model or experiment for the fair, on some predictable math-y or science-y topic. But that’s not his thing so we had to dig into his world to find something for him to present. And where did that lead us? To the sort of work that is hip and newfangled and probably much more practical to T’s future than a tired model of a molecule would be.
He wows me all the time.
This is fantastic example of an innovative approach you used to meet T’s needs and interests–and then he took it and flew away! Do you mind if I share it on my Google, Twitter and Pinterest accounts? Love your great DOF photo of T.
Thanks, Kristin. Share away!
(I am a bit of a floozy for a short depth of field.)
I love this.
Thanks, Amy!
What program did he use to create those great infographics? My 9 year old has a project coming up where the creation of infographics might be PERFECT!
He used Canva. There’s a link towards the end of the post. It’s not designed for kids, and there might be easier ones out there, but this is the best we’ve found so far. There’s a bit of a learning curve–getting the fonts the right size, for example–but we were able to figure it out, working together.
Thank you – will check out the link. Sorry I missed that…
Just Wow. I have a son who is exactly this way and this is definitely something I am going to incorporate. Thanks…I needed this info.
Yes, Angela, I think there’s a certain type of boy that loves information and can really appreciate this sort of thing. May as well go with that, right?
Great job T!
Thanks for the link, I am going to show Canva to my boys later 🙂
It’s a little tricky, Irish Mum. It’s not designed for kids, but it’s doable if they have time to play with it, and if they can get a little help if they need it. It really is a nice platform for making graphics if you aren’t a professional, and you don’t have access to the fancy stuff.
the best part?
that last sentence…”he wows me all the time.”
just amazing.
🙂
What a beautiful story. I love everything about it.
And I love having my posts referred to as stories. That’s how I like to think of them too. 🙂
What a great project – thanks for the inspiration!
Thank you, Amy!
What a wonderful post. The funny thing is, Patricia, that as I was reading it, I was enjoying the story, as always, and appreciating the home-ed theory, as always, and feeling friendly towards you, as always, but I was also being aware of your voice, I guess, and reflecting on your writing style, which is pretty new, for me. And I think a lot of that’s developing from reading this blog. So, thanks for that.
Wanderingsue, that’s probably one of the most meaningful compliments you could give me. I’m happy for both of us! xo.
This is wonderful! I have been having a hard time getting my boys into projects but they tend to find ways to incorporate Lego, Pokémon and Minecraft into other parts of their day. They have yet to do research on these kinds of intersts – or other interests for that matter – which I am trying to work on the being up for (any tips?). I am going to check out the free program you mention – what a wonderful project and I love the ways that T connected stats from his favourite game to other things. Awesome!
Hmm, research for younger kids… Mr. T has always been into those books that are information guides for things he’s interested in, such as this Pokemon guide: http://store.scholastic.com/Books/Paperback-Books/Pokemon-Ultimate-Handbook Also, ultimate guides and books with facts about all sorts of topics. There are so many great ones for kids these days, with fascinating facts and good graphics. Those are a good way to hook kids into research and data. There are also websites with lots of data, of course, such as this Pokemon one: http://pokemondb.net (I just looked at it quickly; you should vet it yourself.) With younger kids, I suppose you could do some online research searching for data about their interests, and you could curate a list for them. Minecraft, in particular, has amazing data if you look into how many people play; maybe you could share that with your kids, and help them put those numbers into perspective by looking for other data to compare to, as T did. It’s neat for kids to see that something they love is wildly popular, and to be able to put the numbers in layman’s terms so they can brag to others about it!
What wonderful ideas, thank you, Patricia. And I think getting the boys to do something similar to what T did but with Minecraft is brilliant…gee…why didn’t I think of that! 🙂
I just discovered your blog through curriculum choice. I’m so excited! I need more motivation and help in teaching writing to my kids!
Welcome, Sandy! Thanks for visiting. We have lots of enthusiasm for writing in these parts. Read away!
You know what I love about this post? I learned new things! Now, I enjoy seeing your boy do amazing and wonderful work that gives him joy, but, I really love going on the learning journey through the links in your post. Jer Thorp is a very cool guy. I had never heard of him or the work that he does. I just read about API. In my world of education that means something very different (scores on state wide tests that give a school a “grade”) than Jer’s explanation. It is simply a way for software to “talk” to each other. Brilliant.
I checked out the link on info graphics and shared them with my 18 year old statistics nut. He thought it was pretty “legit”. Then we had a conversation about video games. That rarely happens!
The world is a changing and we have to keep up. Thanks for keeping me in “the know”.
I’m so glad to hear that you learned some new good stuff via my post, Wendy. I’m also glad to hear that someone actually clicks on my links! Isn’t Jer’s work fascinating? I love learning all these new things too; it’s especially great when we learn something because of our kids. Gotta keep up! (You got that right.)
Wow, Patricia!
I don’t have the brain power for a creative response right now but I love this! I will be coming back to it. I think F will be able to relate to this concept and may want to make her own infographics!
Creative responses are never necessary, Dawn–I’m happy for any kind of response from you! Infographics are cool. Minimal writing–but the writing that’s there, combined with the visuals, make a big impact.
That is pretty cool stuff. If my kid’s brain continues to demonstrate similar tendencies to his father’s (also my husband), I have a feeling that infographics are in my future.
Good to be one step in front of your kid, Eliza–at least while you can!
This is wonderful–the infographics T. created are extremely persuasive, memorable, and thought-provoking. What great comparisons! I’ll bet this was a hit at the fair.
I’ve really appreciated your posts about infographics as a very legitimate form not just of sharing information efficiently but of exploring information and ideas in new ways–did you see that there’s now a Best American Infographics series?!? So cool!
Recently my 8-year-old daughter and I were inspired to do something infographic-ish by a quiz in Muse Magazine that was designed as a kind of two-page flow chart. The original quiz was “Which legendary creature are you?” as in Bigfoot, the Yeti, and so on. We did a “Which Harry Potter creature are you?” It was quite challenging to lay out properly but did get us thinking a lot in terms of categories (creatures with scales, creatures with fur, creatures who hate humans, creatures who love to serve humans), and in the end we really enjoyed the process.
In our writing group, last fall we looked a lot at ultimate guides and the infographics in them, too. Each kid played with exploring a topic a bit ultimate guide-style, with lists, quizzes, and in some cases, labeled diagrams. Great fun! We had everything from Dr. Who to Star Wars to snakes to an ultimate guide to an imaginary, Dr. Seussian world on Pluto.
Thanks again for the continuing inspiration–I’m often amazed by how similar T.’s mind appears to be to my own boy’s. He loves information-rich compendiums–have you guys delved in to the Bathroom Readers series yet? B. is constantly spouting interesting facts that invariably came from the Bathroom Reader! I’m guessing you’ve seen the Horrible Histories, too. They really are Horrible in some cases, but they were a great resource on our family trip to England.
Cheers to you and happy homeschooling this spring!
Hey Carrie,
Yes, we did see the Best American Infographics book! T snatched it up.
You caught precisely what I was trying to get at in my post–infographics are a valid way of sharing information, and are becoming increasingly important in our digital culture. It was really T who led me down this path, as he simply seems to process information this way. He’s moved by information presented this way. So I needed to learn more about it, and help him use the form on his own.
Your daughter is eight already? Holy cow! I love what you did with the Harry Potter quiz. I think it’s only when delving in and trying to make an infographic of your own that you realize how complex they are, and how much work and thinking goes into them.
We don’t have the Bathroom Reader series, but I’m adding it to our list…
Happy homeschooling right back at you!